

 TANGAZO KWA WATOA HUDUMA WOTE KWENYE SEKTA YA ...
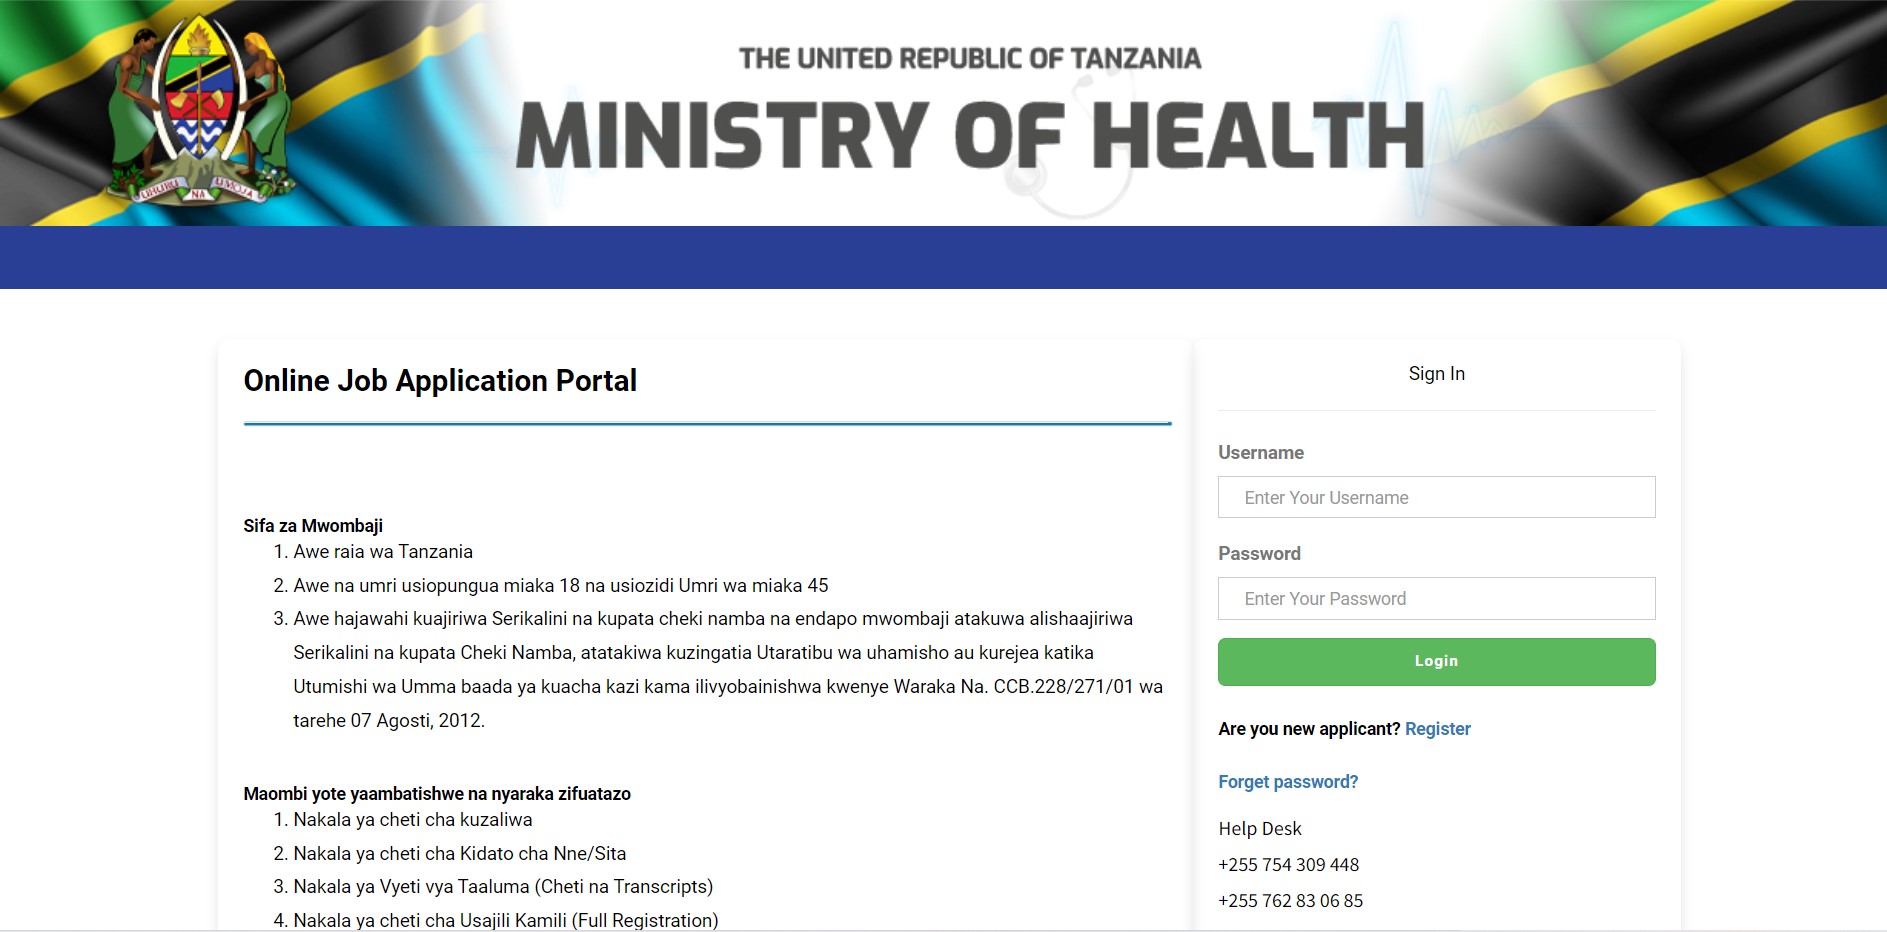
TANZANIA DIGITAL HEALTH STRATEGY 2019 - 2024 Download
TANZANIA eHEALTH STRATEGY 2013 - 2018 Download (Previous)
GUIDELINES AND STANDARDS FOR INTEGRATED HEALTH FACILITY Download
INVESTMENT RECOMMENDATION ROAD MAP 2017 - 2023 Down...


Na WAF, TABORA Naibu Waziri wa Afya Dkt. Godwin Mollel ameziasa Kamati za ...Soma Zaidi

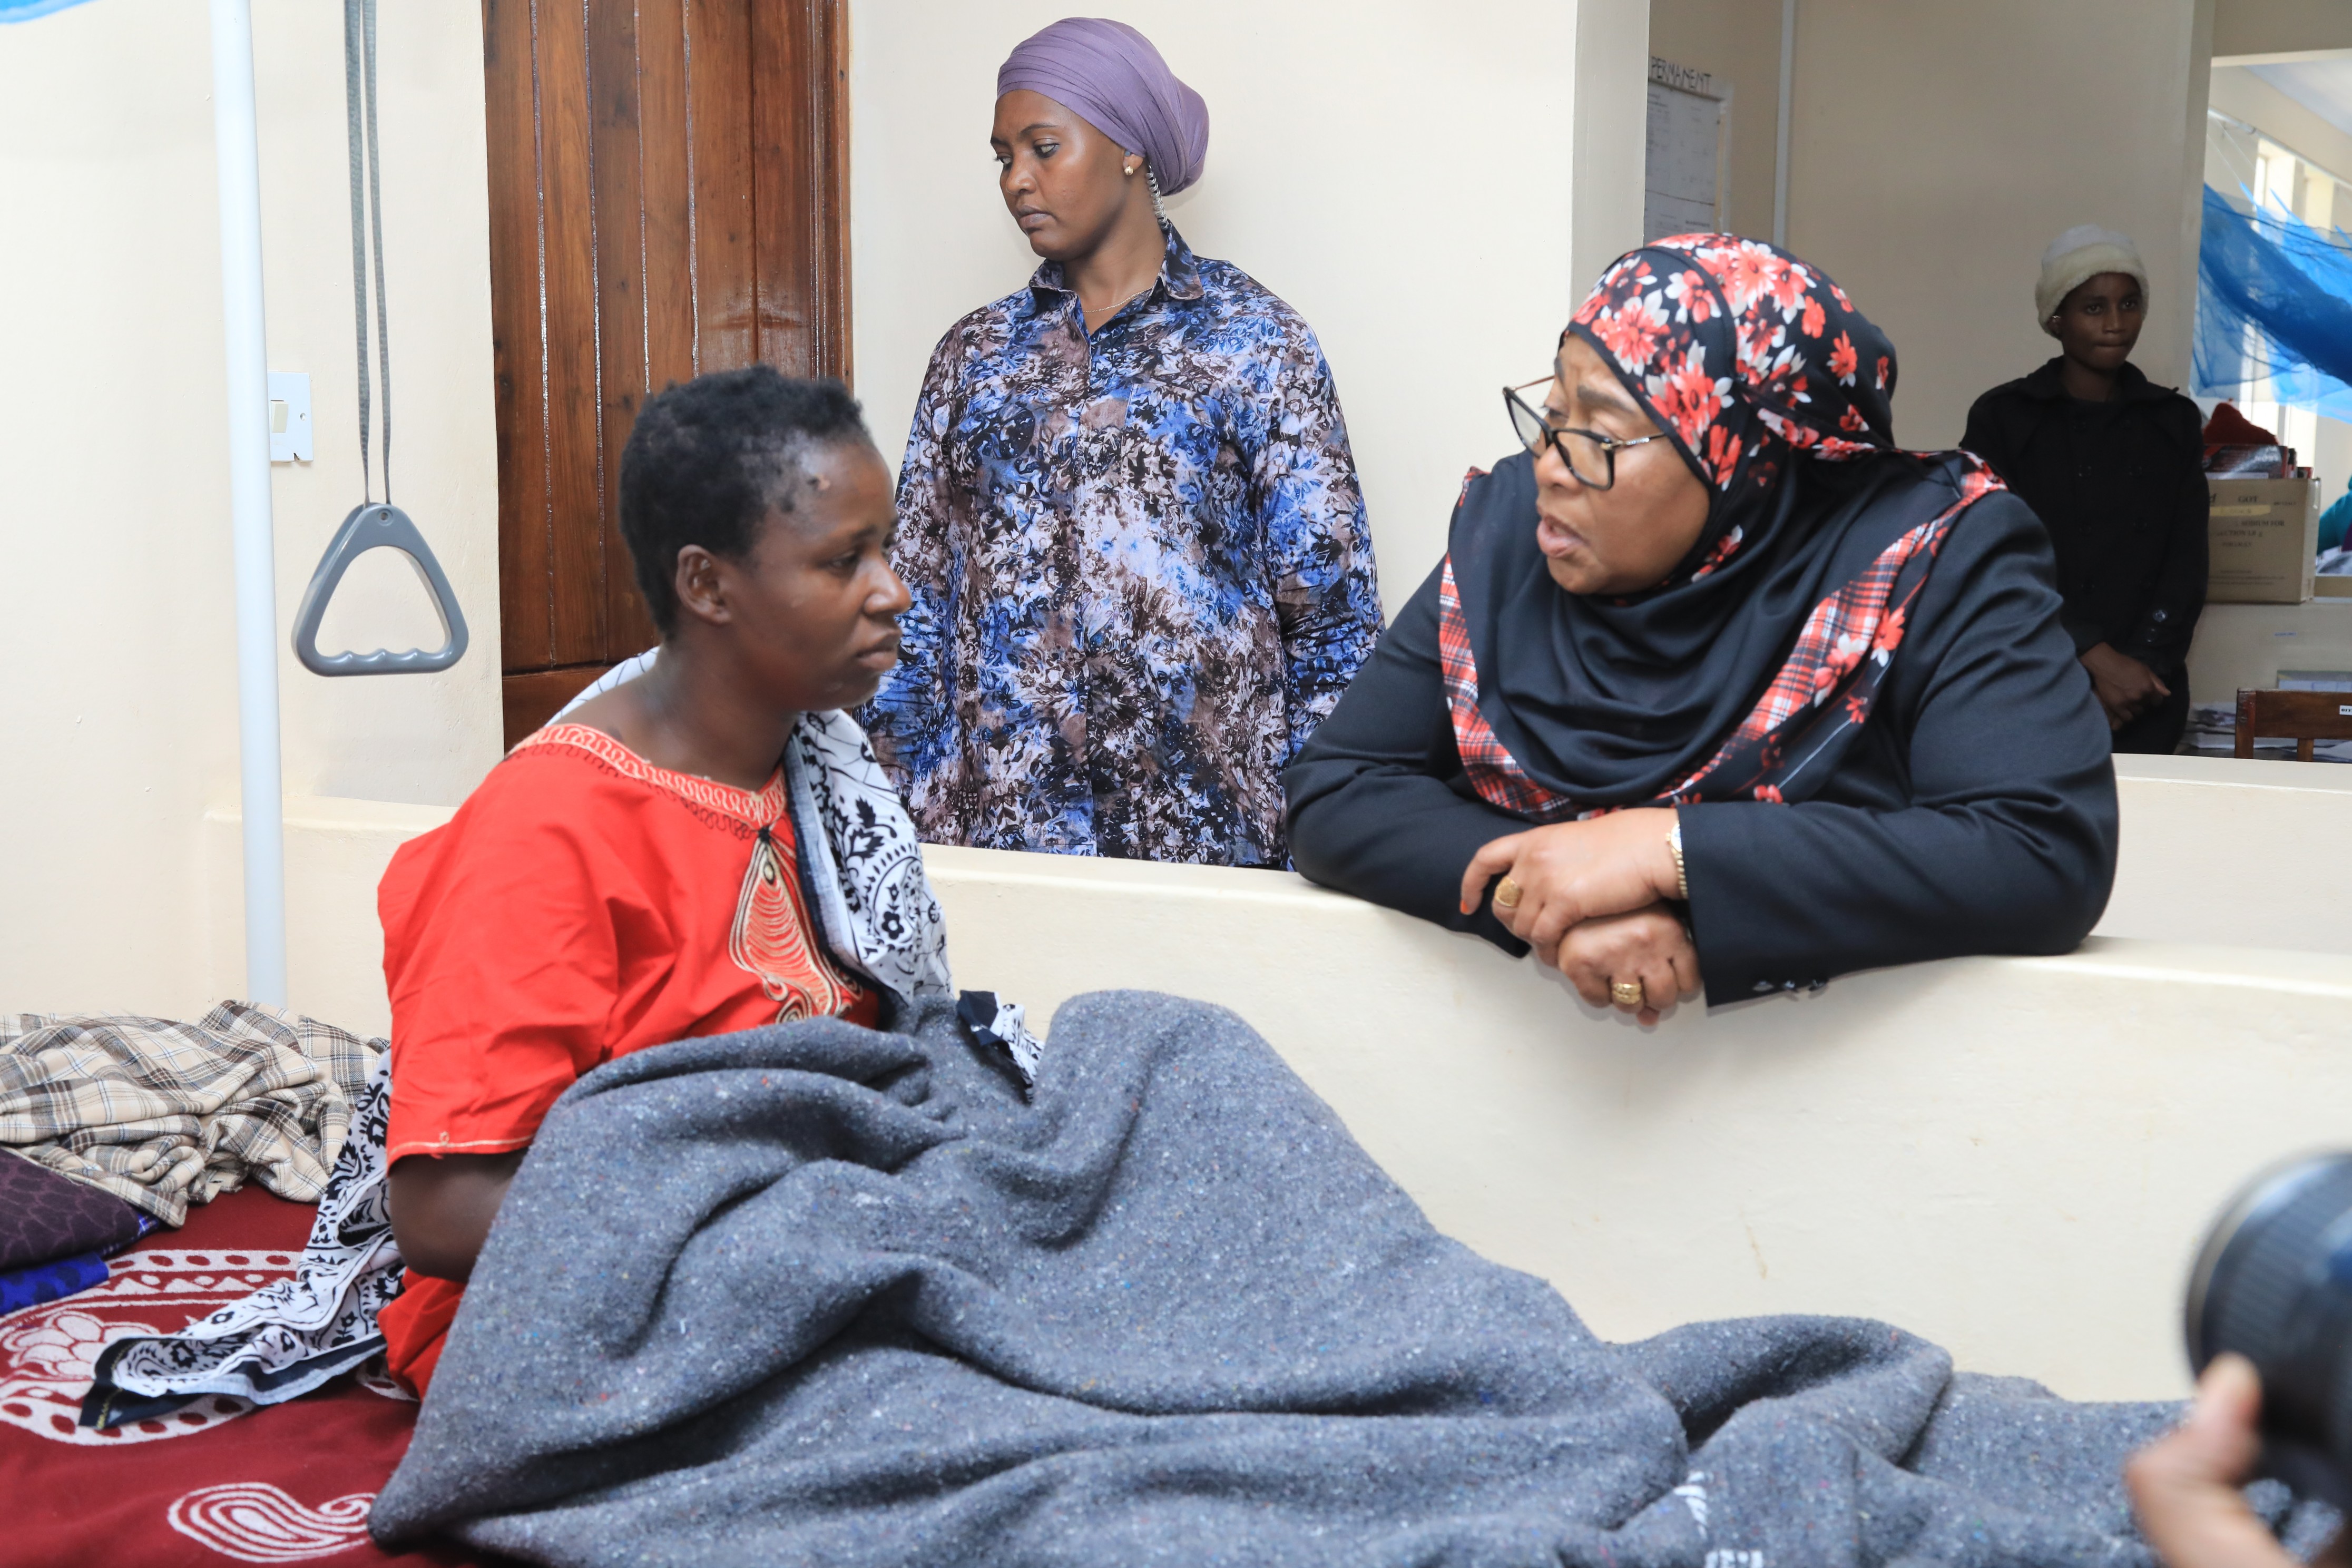
Na WAF - Dar es Salaam Waziri wa Afya Mhe. Ummy Mwalimu amese...Soma Zaidi

Katibu Tawala Mkoa wa Njombe ametoa wito kwa wataalamu wa afya kuimarisha Upa...Soma Zaidi

Na WAF - Mwanza Serikali kupitia Wizara ya Afya imepanga hadi kufikia Di...Soma Zaidi

Na WAF – Mtwara. Mkuu wa Mkoa wa Mtwara Kanali Patrick Sawala ametoa rai...Soma Zaidi

Waandishi wa Habari Mkoa wa Tabora wadhamiria kufanya kampeni kukabiliana na Ugonjw...Soma Zaidi

Na WAF - Mwanza Waziri wa Afya Mhe. Ummy Mwalimu amesema dozi Moja ya ch...Soma Zaidi

Na WAF - Arusha Katibu Mkuu wa Wizara ya Afya, Dkt. John Jingu, amewataka w...Soma Zaidi

Epidemiological Weekly Report
readmore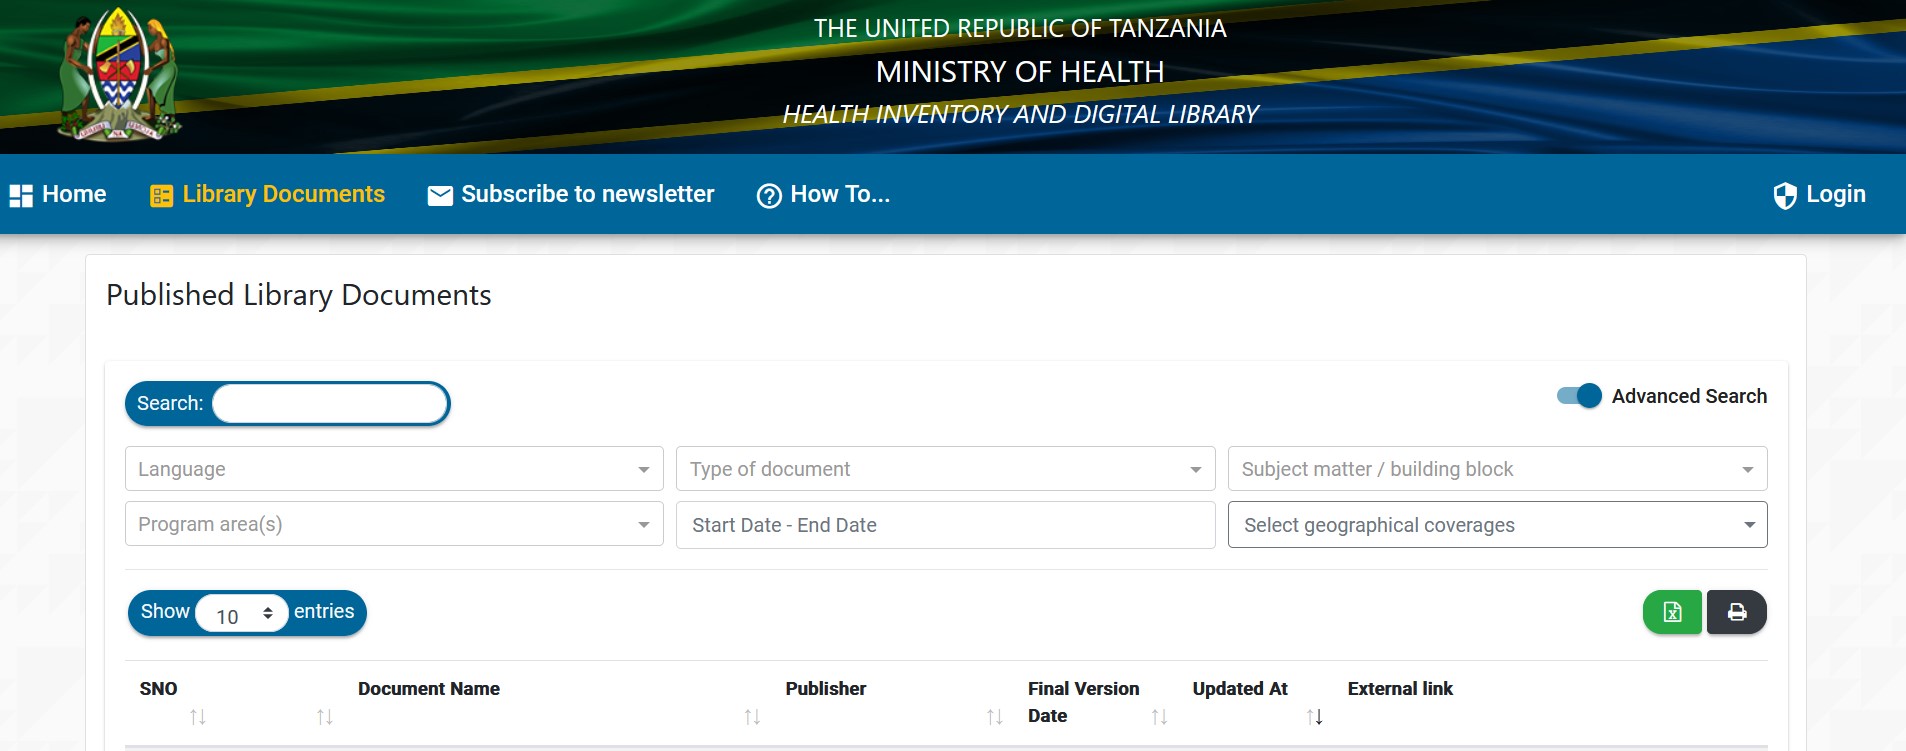
Pakua nyaraka mbalimbali za Wizara ya Afya kupitia kiunganishi http://hidl.afya.go.tz/#/library/dashboard/published-list
readmoreDUP OVERVIEW

DATA USE PARTNERSHIP INITIATIVE
The Data Use Partnership (DUP) is a government-led initiative that is improving the national health care system through better use of health information. Under DUP, the government is working with...
readmoreThe following are the primary functions of RCHS: